Process raster results
Conveyal provides multiple ways to compute summary indicators for completed regional analyses. Examples include:
- Average number of schools reachable within a 20 minute bike ride for residents of a city,
- Number of jobs reachable in a 45 minute commute by the median household in a specific neighborhood, and
- Increase in these numbers (relative to a baseline scenario) resulting from a proposed transport network.
You may also want to compute a single composite index, or a complex indicator combining different logical conditions or spatial layers.
This guide provides a few examples of calculating such indicators from raster (grid) files downloaded from Conveyal. By default, travel time results, regional access results, and uploaded spatial datasets are all available for download as raster files with consistent resolutions.
The Conveyal team is considering ways to support additional holistic indicators directly in the interface; contact your support team if you have specific requests or ideas. In the meantime, you can compute a wider range of indicators by downloading results and running custom calculations in offline GIS software (we recommend QGIS), as the examples below show.
Percent difference between two scenarios
The regional analysis interface in Conveyal can display the absolute difference between two sets of results (e.g. a proposed scenario minus a baseline scenario):
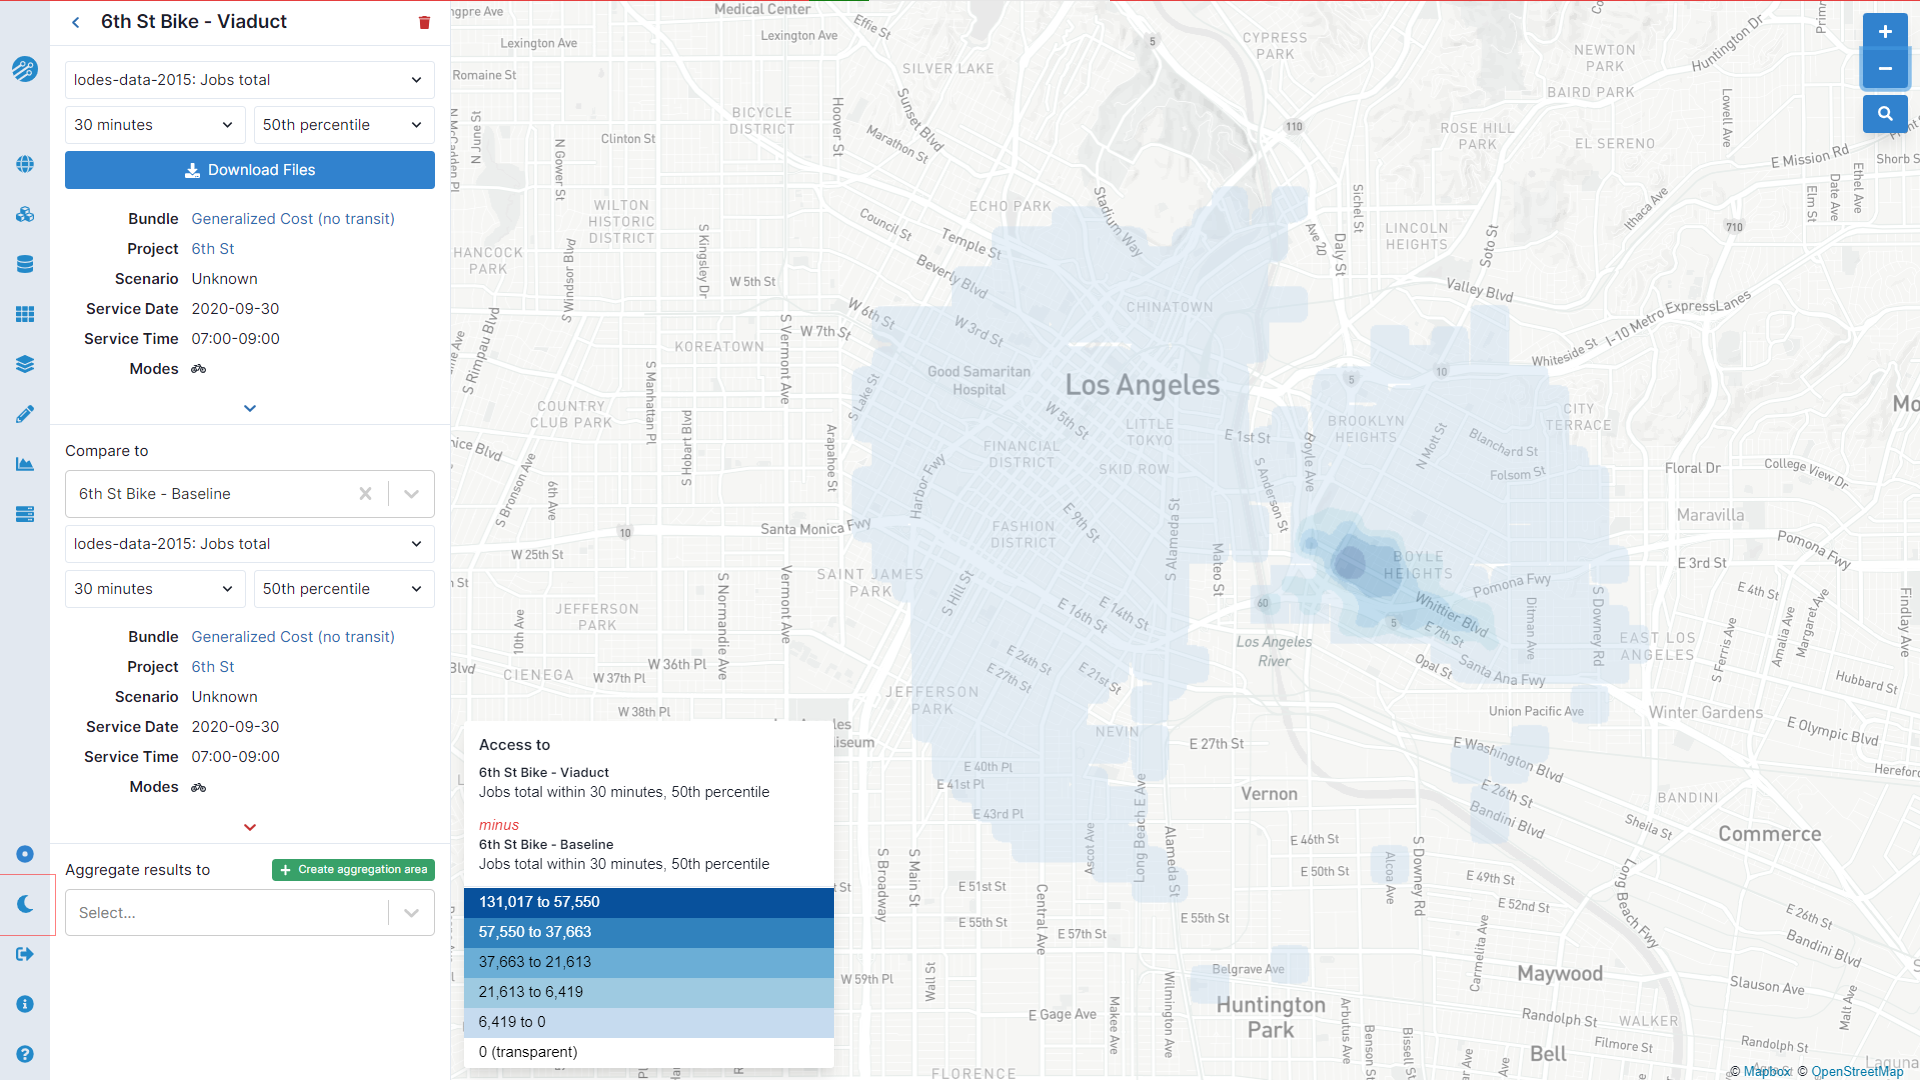
If you instead want a map of the percent difference between two sets of results (e.g. to highlight places with large changes relative to access levels in the baseline scenario), follow these steps:
- Navigate to the first set of results, download the GeoTIFF file, and rename it to something that will be convenient and recognizable when opened in GIS.
- Switch to the set of results you want to see in relative terms and also download it and assign a name.
- Open both downloaded GeoTIFF files as raster layers in GIS software, and rename them for convenience (e.g.
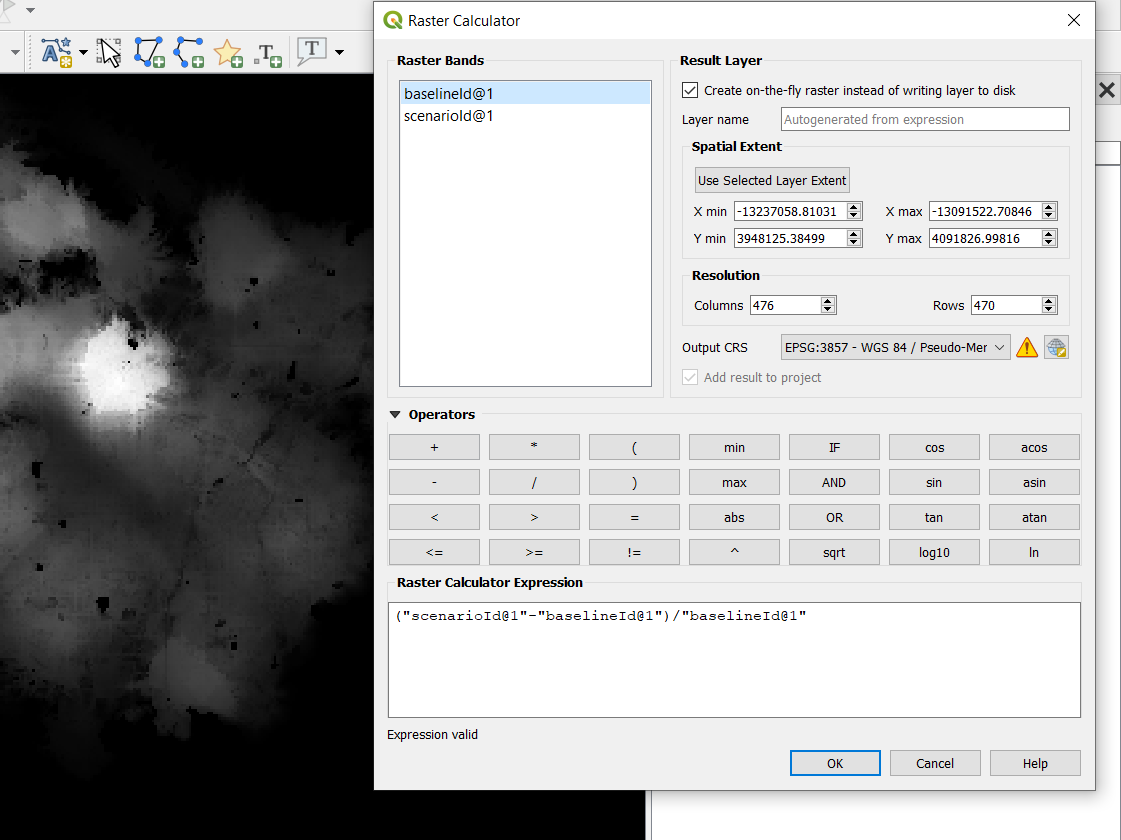
scenario1andbaseline). - Use the GIS raster calculator, with an expression to calculate the percent difference:
("scenario1@1" - "baseline@1") / "baseline@1". The@1indicates the first band of each raster.
- Style the result layer accordingly. You may need to set reasonable min/max values and bins.
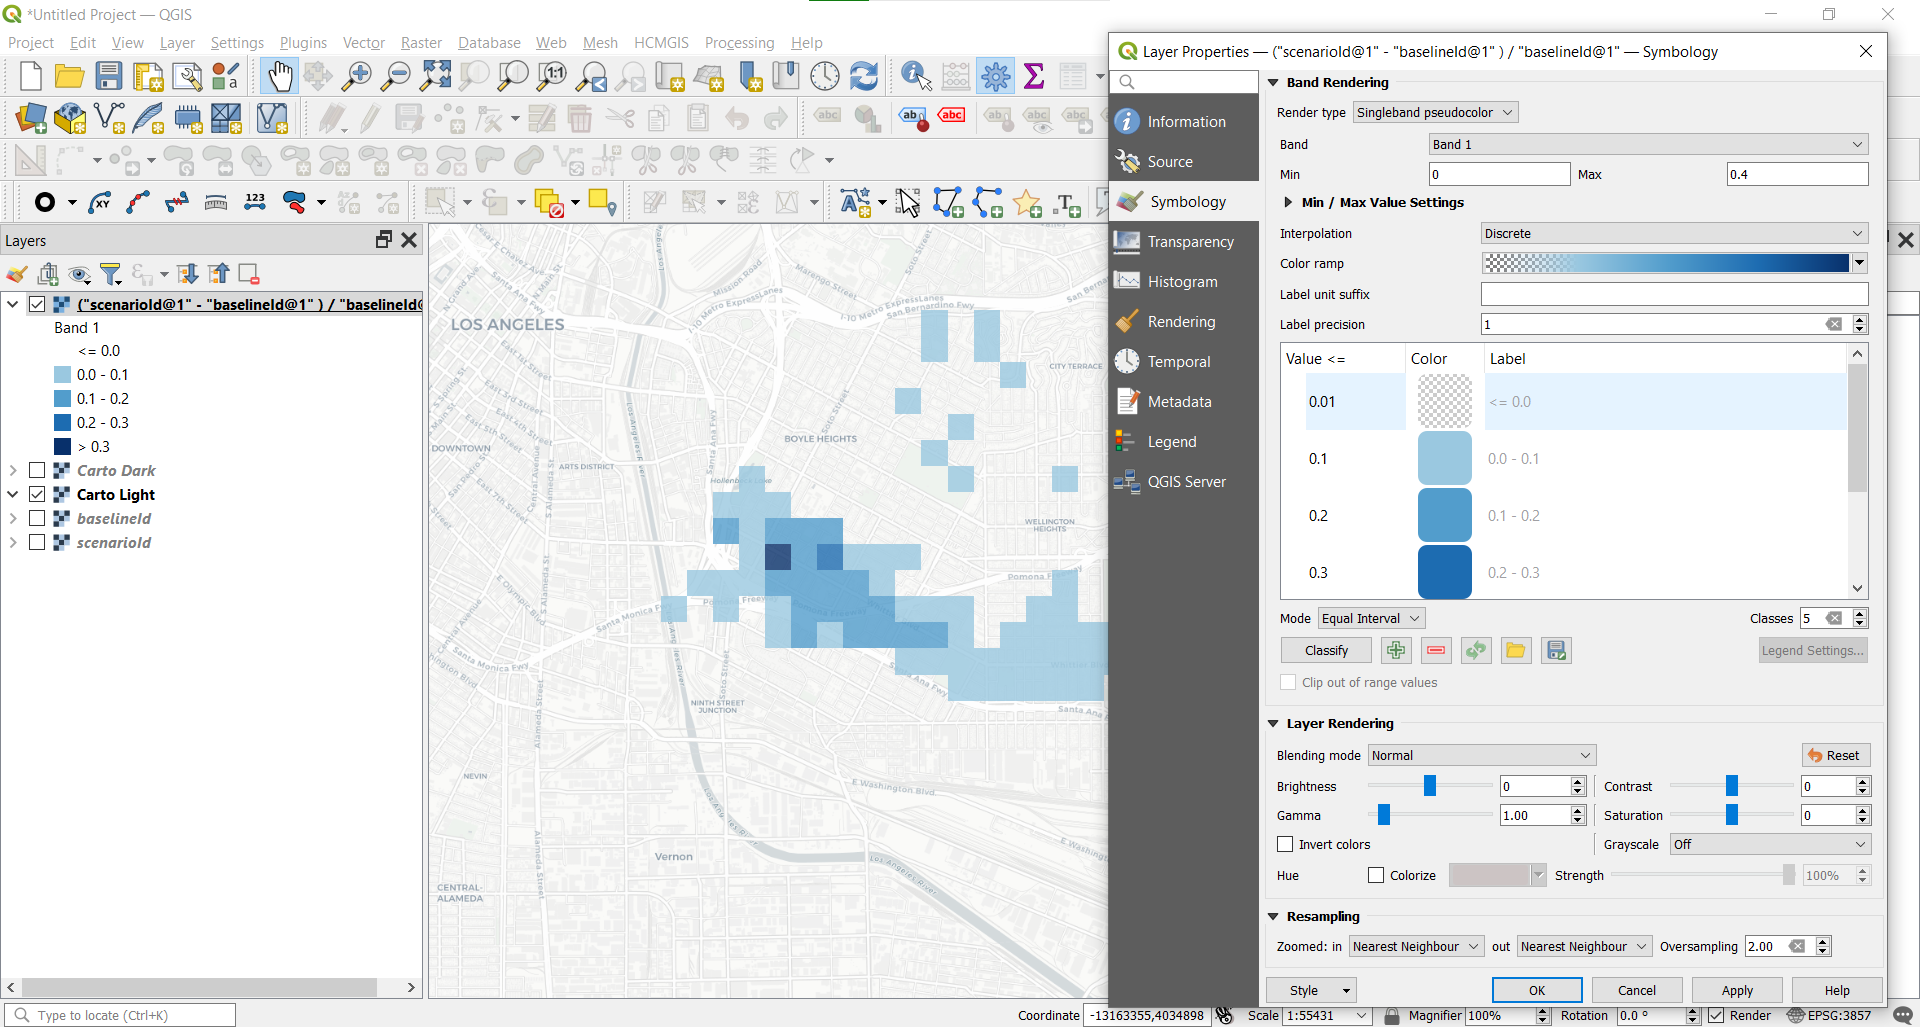
In this example, a new bridge increases access to jobs within a 30-minute bike ride, by up to 30-40% in the darkest blue areas.
Households benefitting from a proposed scenario
If you want to calculate the total number of households (or residents etc.) who benefit from a given scenario, we recommend running analyses with a logistic decay function, then following the steps below. The logistic decay function smooths results and allows the access indicator to account for all potential destination locations in a region, rather than just those destinations in narrow band around a chosen cutoff value. With this and other gravity-style decay functions, closer destinations are considered more valuable, so reducing travel time to any destination yields a benefit. For more details, see the example in the decay function guide
- Repeat the first three steps above.
- Download the household layer as a GeoTIFF (.tif) file from the spatial datasets page.
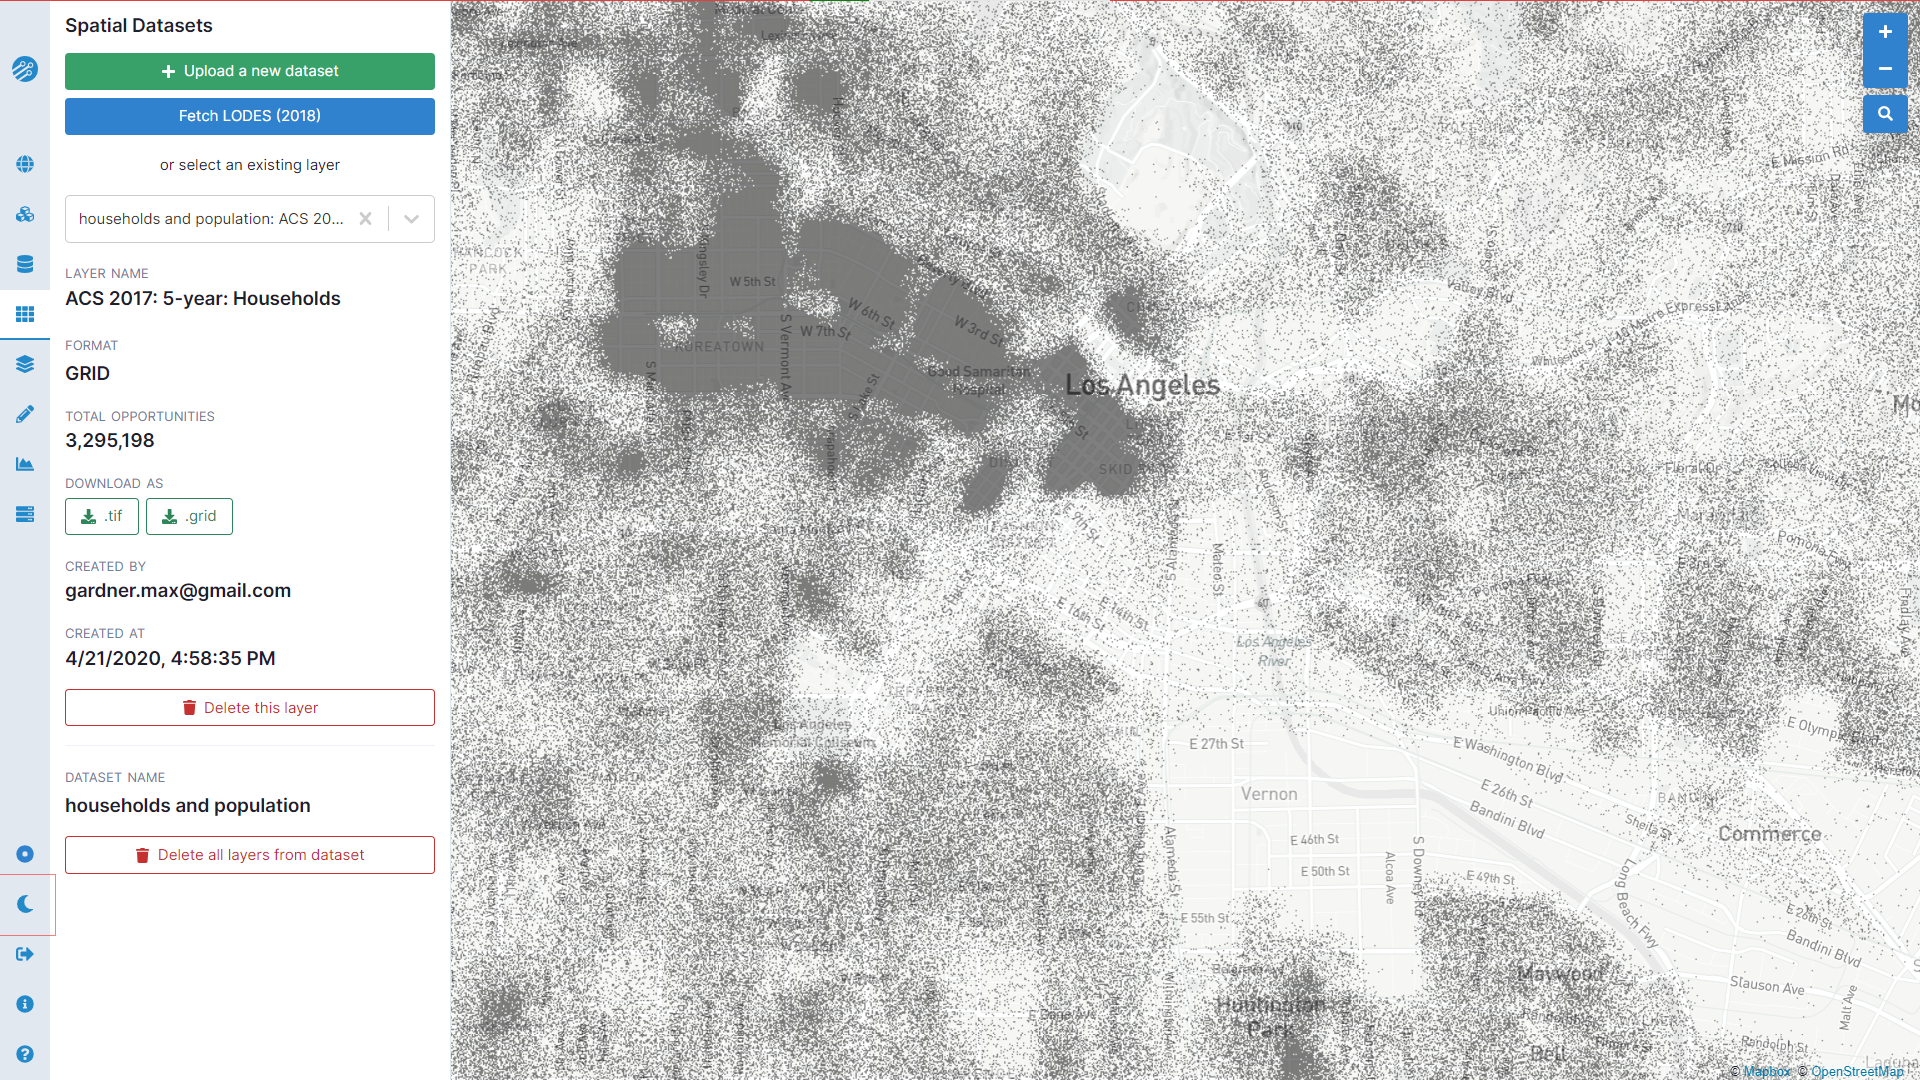
- Open the households layer in GIS software, and rename it for convenience (e.g.
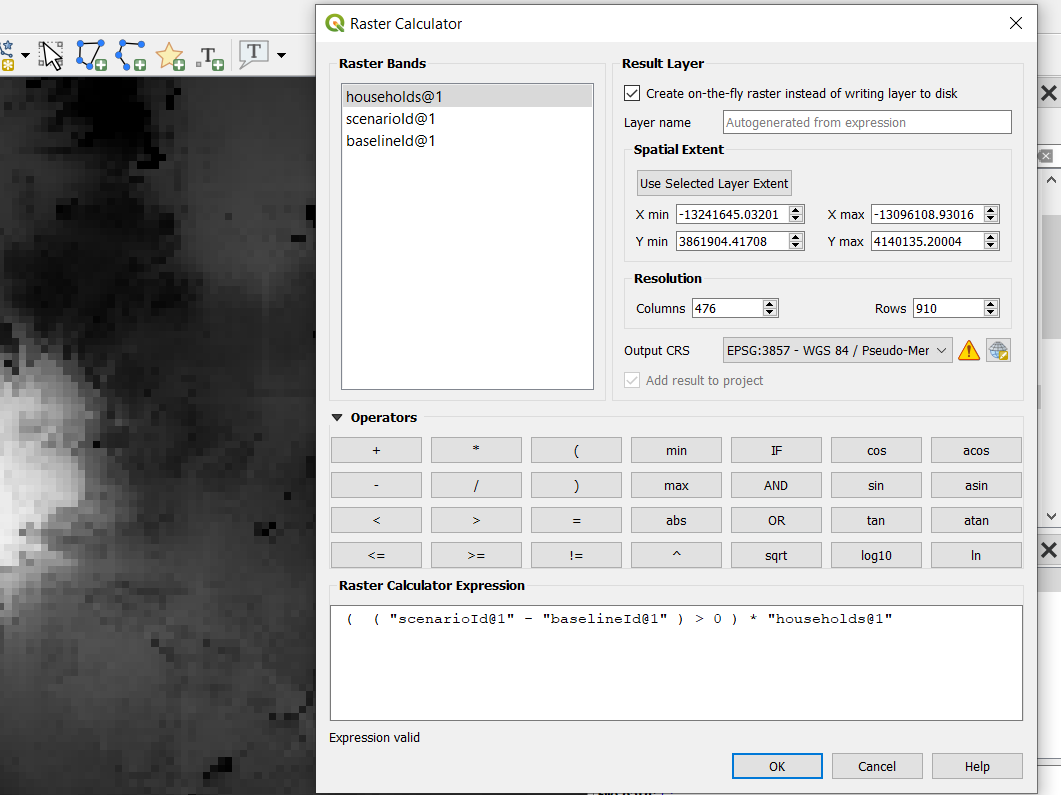
households). Note that by default, this will have the same grid resolution as the regional analysis results - Use the GIS raster calculator, with expression
(("scenario1@1" - "baseline@1") > 0) * "households@1"). This calculation uses a logical condition (> 0), resulting in a boolean layer with 1 where the condition is met and 0 otherwise. Multiplying this layer by the households layer yields a result where the cell value for cells with increased access is the number of households, and the cell value for cells without increased access is 0.
- Use the GIS Raster Layer Statistics tool to compute the sum over the resulting layer.
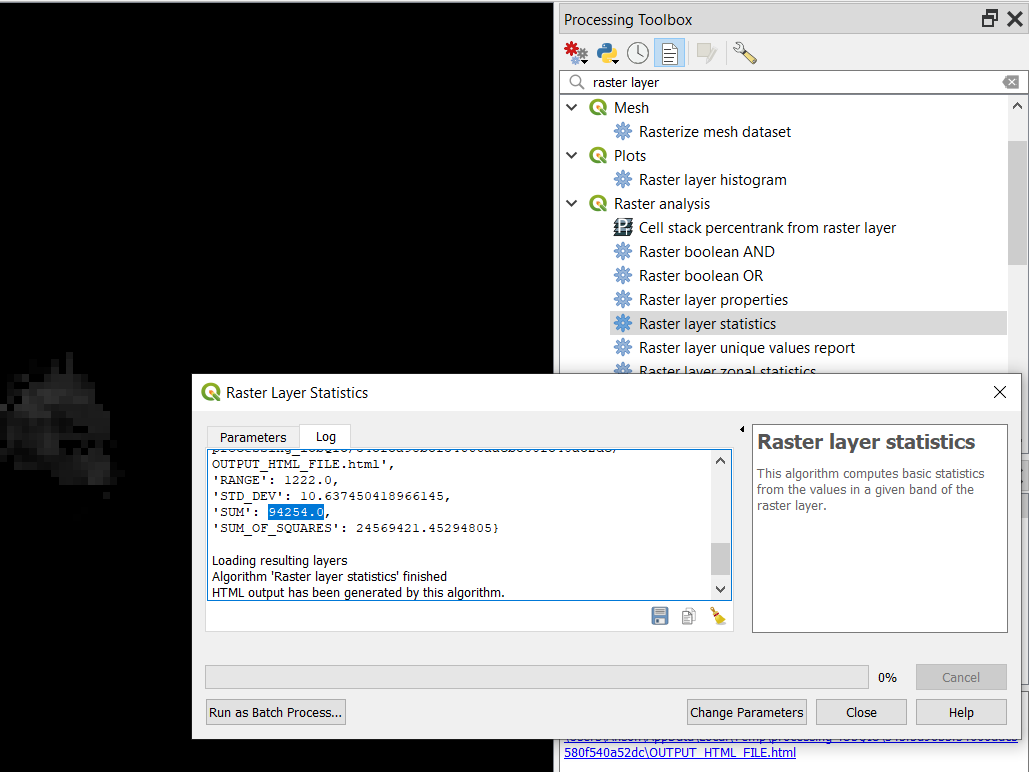
In this example, 94,254 households would see increased access to jobs enabled by the proposed project.
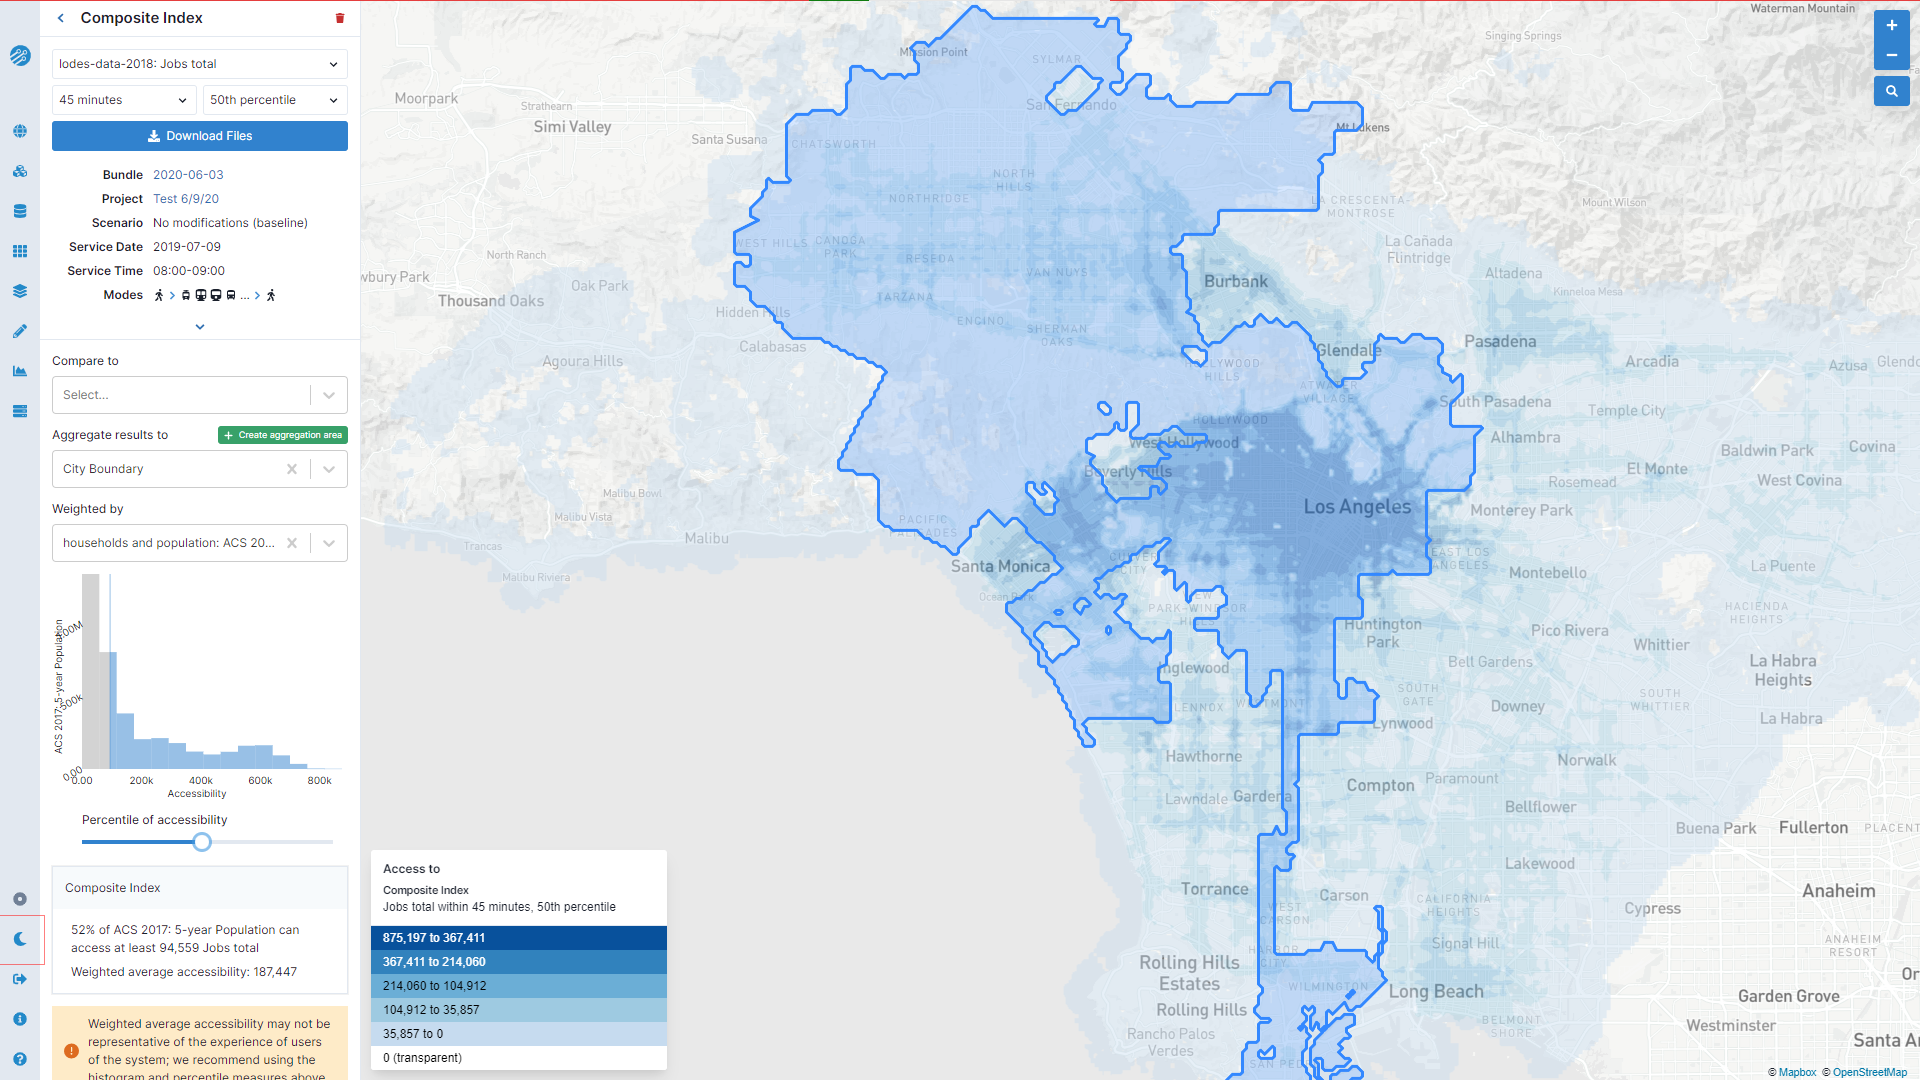
Composite index with multiple destination types and cutoffs
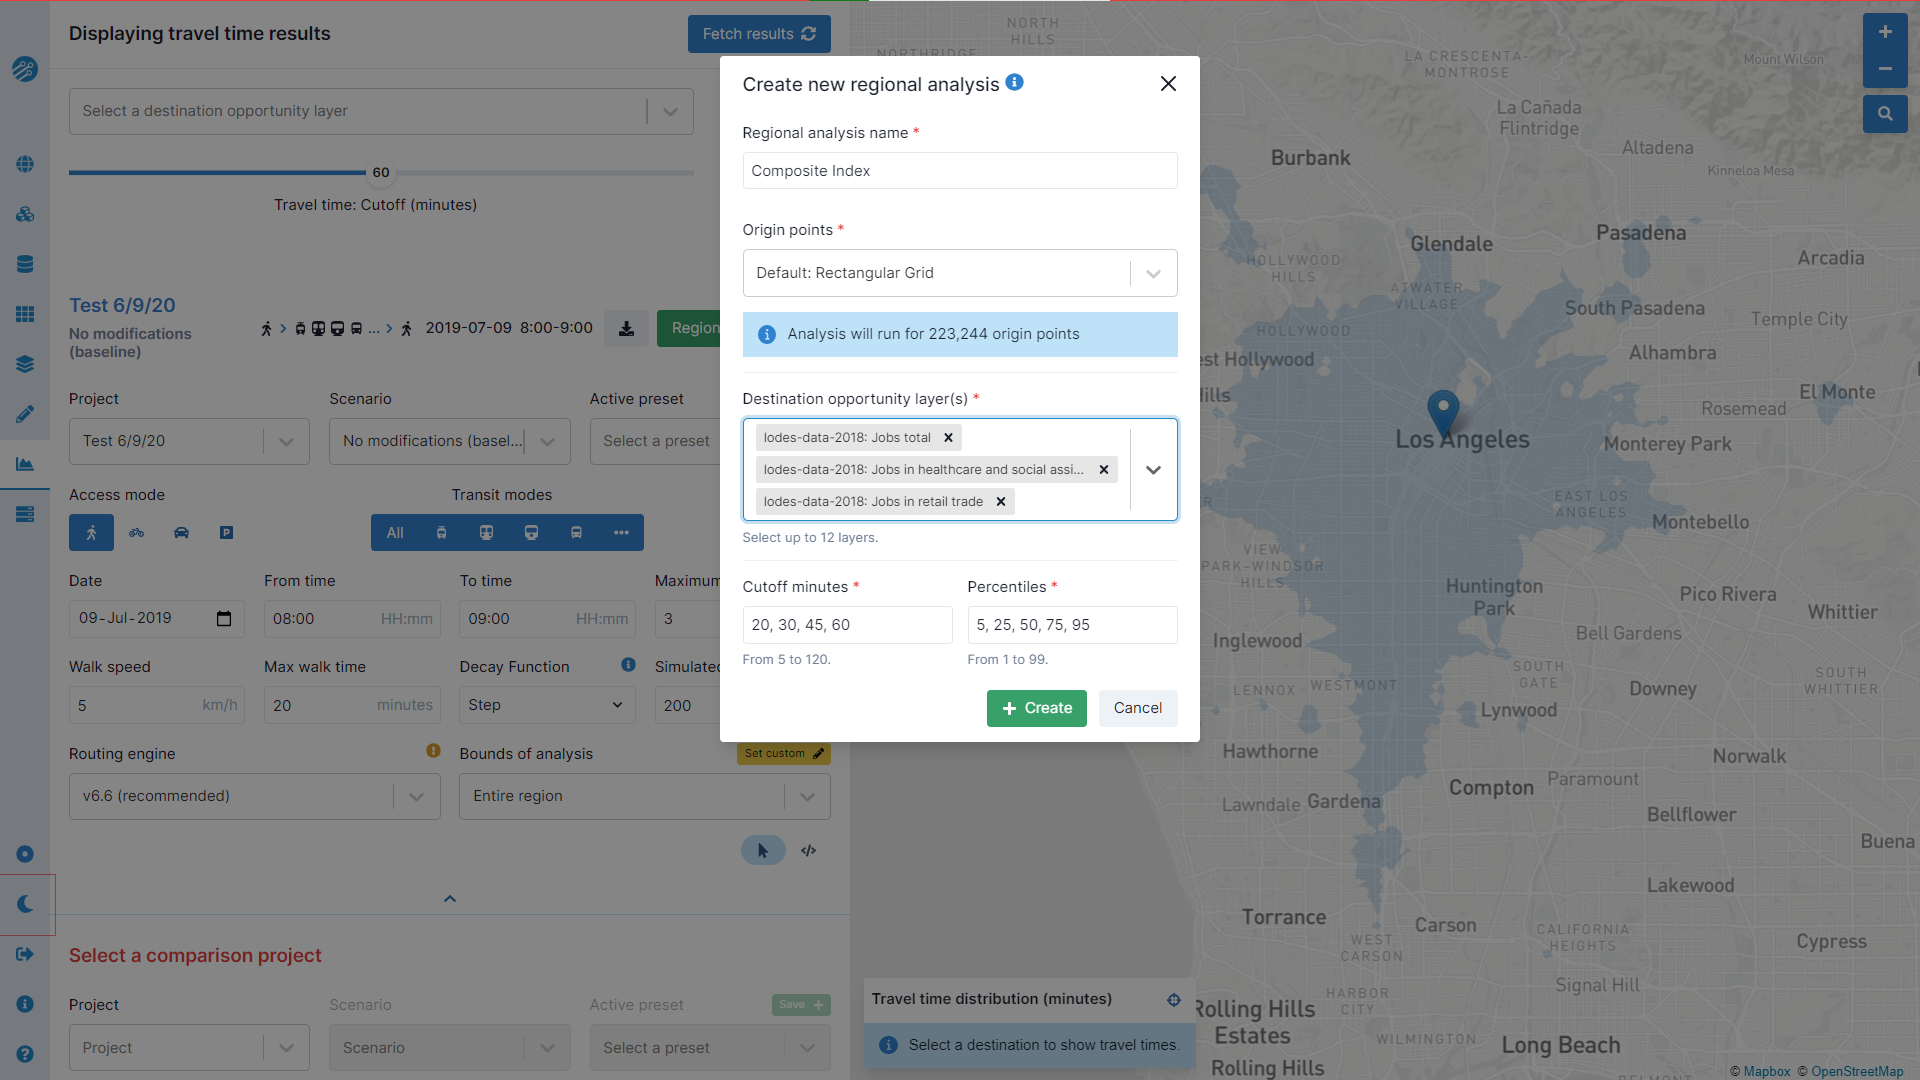
You may want to assess which neighborhoods have access to a range of destinations, using a composite index. For example, the Singapore Land Transport Authority 2040 Master Plan includes a "20-minute town and 45-minute city" goal, which includes providing residents access to neighborhood amenities such as retail and healthcare within 20 minutes, and to a substantial part of the city's wider job market within 45 minutes. Because such destinations are not generally substitutable, we recommend first computing each component separately in a regional analysis, then creating a composite index.
Consider another city with a similar goal and related targets of having 60% of residents able to access:
- 300 retail jobs (as a proxy for neighborhood shopping) within 20 minutes
- 600 healthcare and social service jobs (as a proxy for these facilities) within 20 minutes
- 93,000 total jobs (equivalent to 5% of the total jobs in the city) reachable within a 45 minute trip
To compute how many residents meet these thresholds, follow these steps:
- Run a regional analysis with the appropriate destination types (jobs in retail, health and social services, and total) and travel time cutoffs (at least 20 and 45 minutes).
- Download the regional analysis result for each relevant destination type and cutoff combination.
- Open the three resulting in files in GIS, and rename them for convenience (e.g.
retail-20,healthcare-20, andjobs-45).
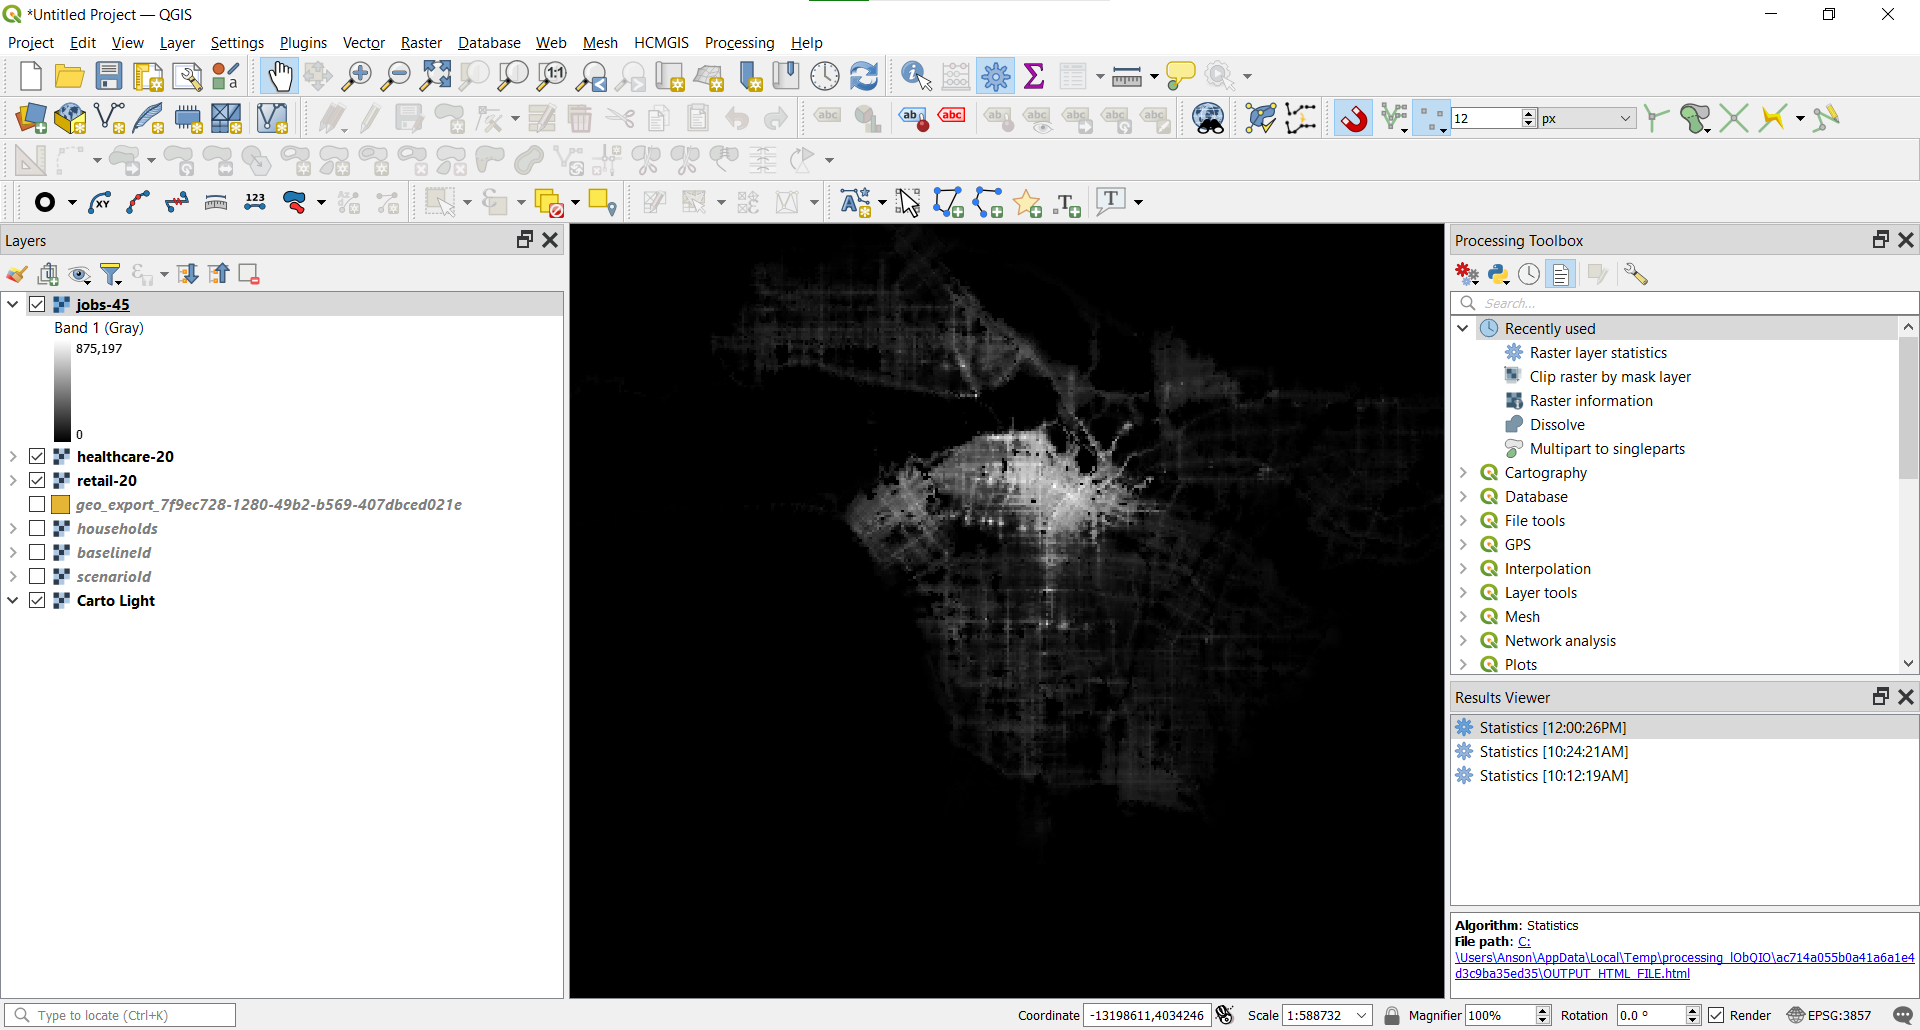
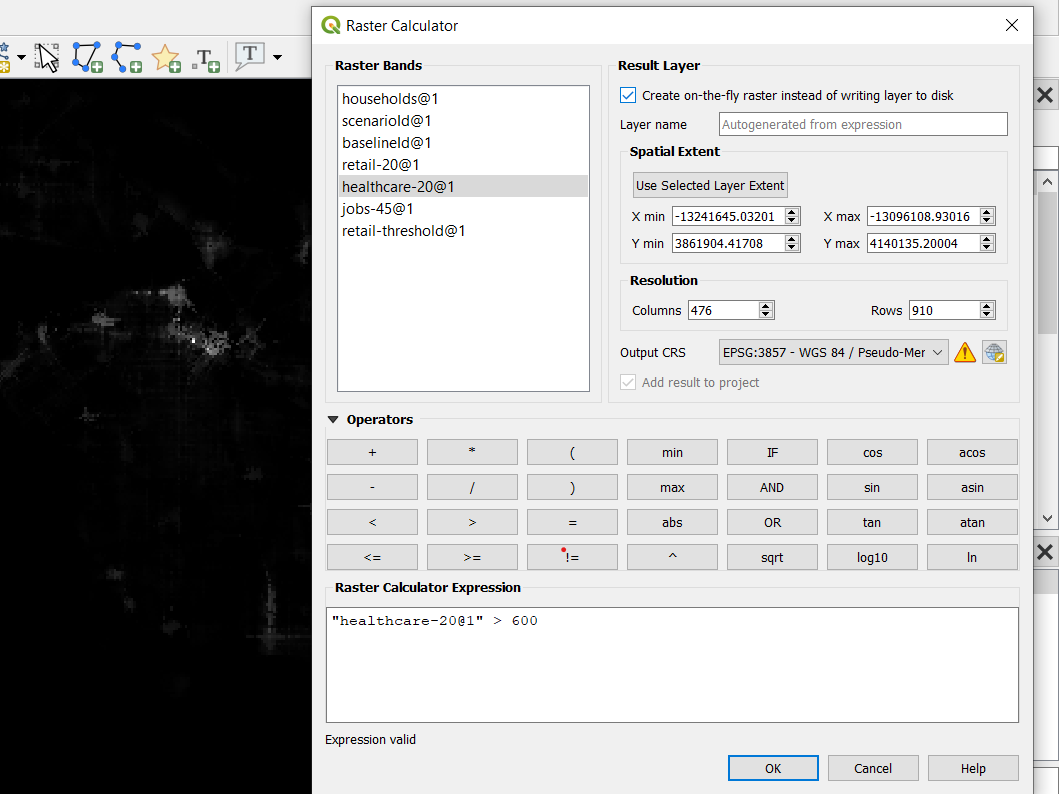
- Use the raster calculator to compute which areas meet each threshold. For example, to map which areas have access to at least 600 healthcare jobs, use the expression
"healthcare-20@1" > 600.
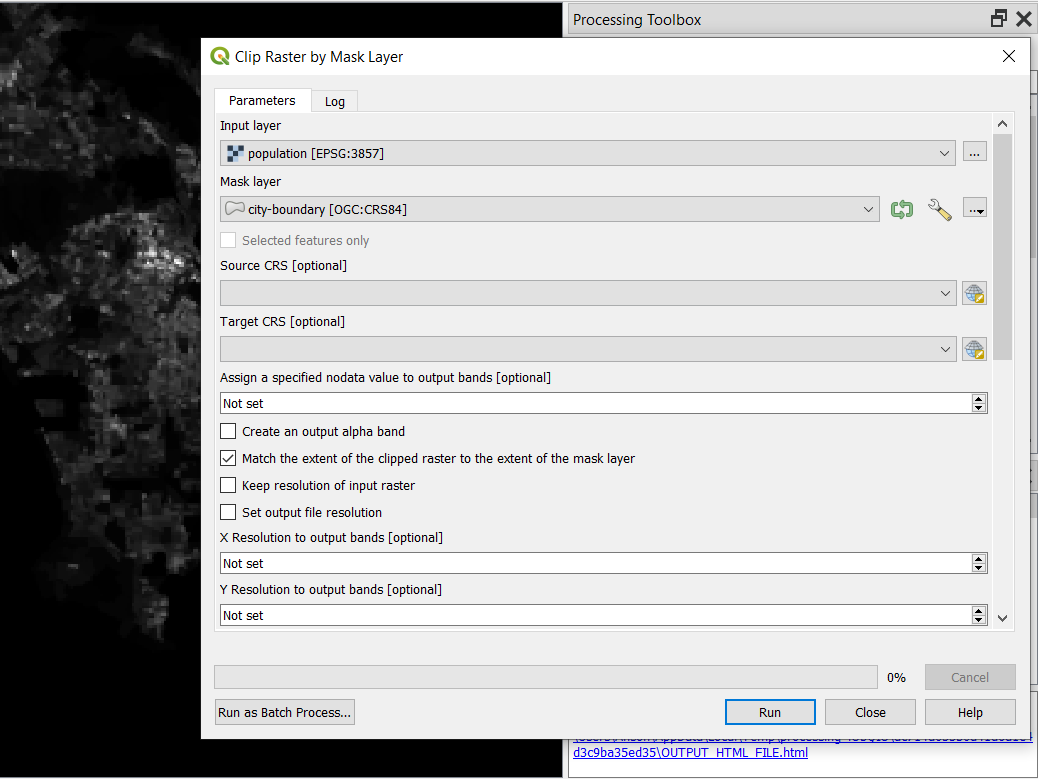
- Download a grid file for residential population from the spatial datasets tab in Conveyal, then load it in GIS.
- Load a vector layer (e.g. shapefile) of the city boundary in GIS, then use the "Clip Raster by Mask Layer" tool to clip the population file to the city boundary.
- Calculate how many residents meet each of the three thresholds, by multiplying the threshold layer by the clipped population layer. Cells in the threshold layer have value 1 if the threshold is met and 0 if it is not, so this layer can be multiplied directly by the clipped population layer:
"healthcare-threshold@1" * "Clipped (mask)@1". Use the GIS Raster Layer Statistics tool to compute the sum over the resulting layer. Note that this step can be approximated in the Conveyal interface, using the aggregation area and weighting features when summarizing a regional analysis.
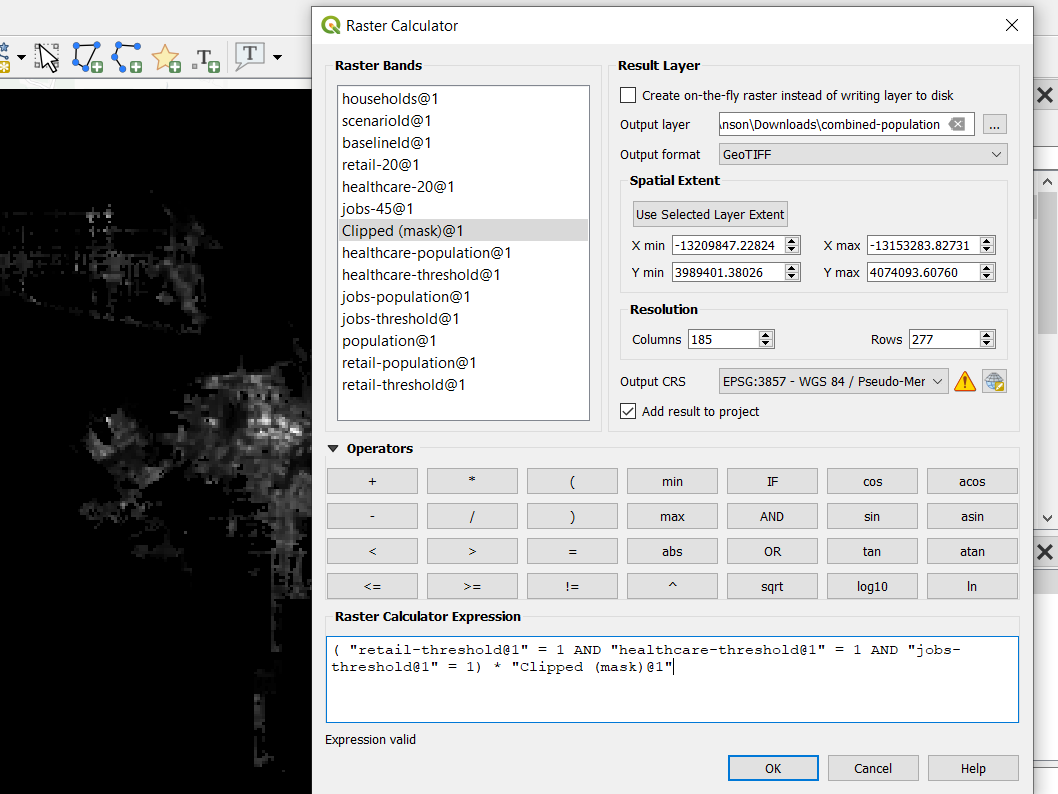
- Calculate how many residents meet all three thresholds. Using QGIS, this final step can be accomplished with the Raster Calculator expression
("retail-threshold@1" = 1 AND "healthcare-threshold@1" = 1 AND "jobs-threshold@1" = 1) * "Clipped (mask)@1"then the Raster Layer Statistics tool run for the resulting layer.
This process yields the following results. Of the 3.9 million total residents in the city,
- 1.69 million (44%) live in places meeting the neighborhood retail access target
- 1.79 million (45%) live in places meeting the healthcare access target
- 2.06 million (52%) live in places meeting the job access target
- 1.21 million (31%) live in places meeting all three targets
Densification, mixed-use development, and improved transport networks could help this city make progress toward the objective of having 60% of residents meeting all three targets.
Similar workflows could be defined for different origin populations. For example, a more salient target could be ensuring car-free households or equity focus areas have certain levels of access.