Smoother regional analysis view
We are pleased to roll out new analysis capabilities and smoother visualizations. This major release includes v7.0 of the R5 routing engine and...
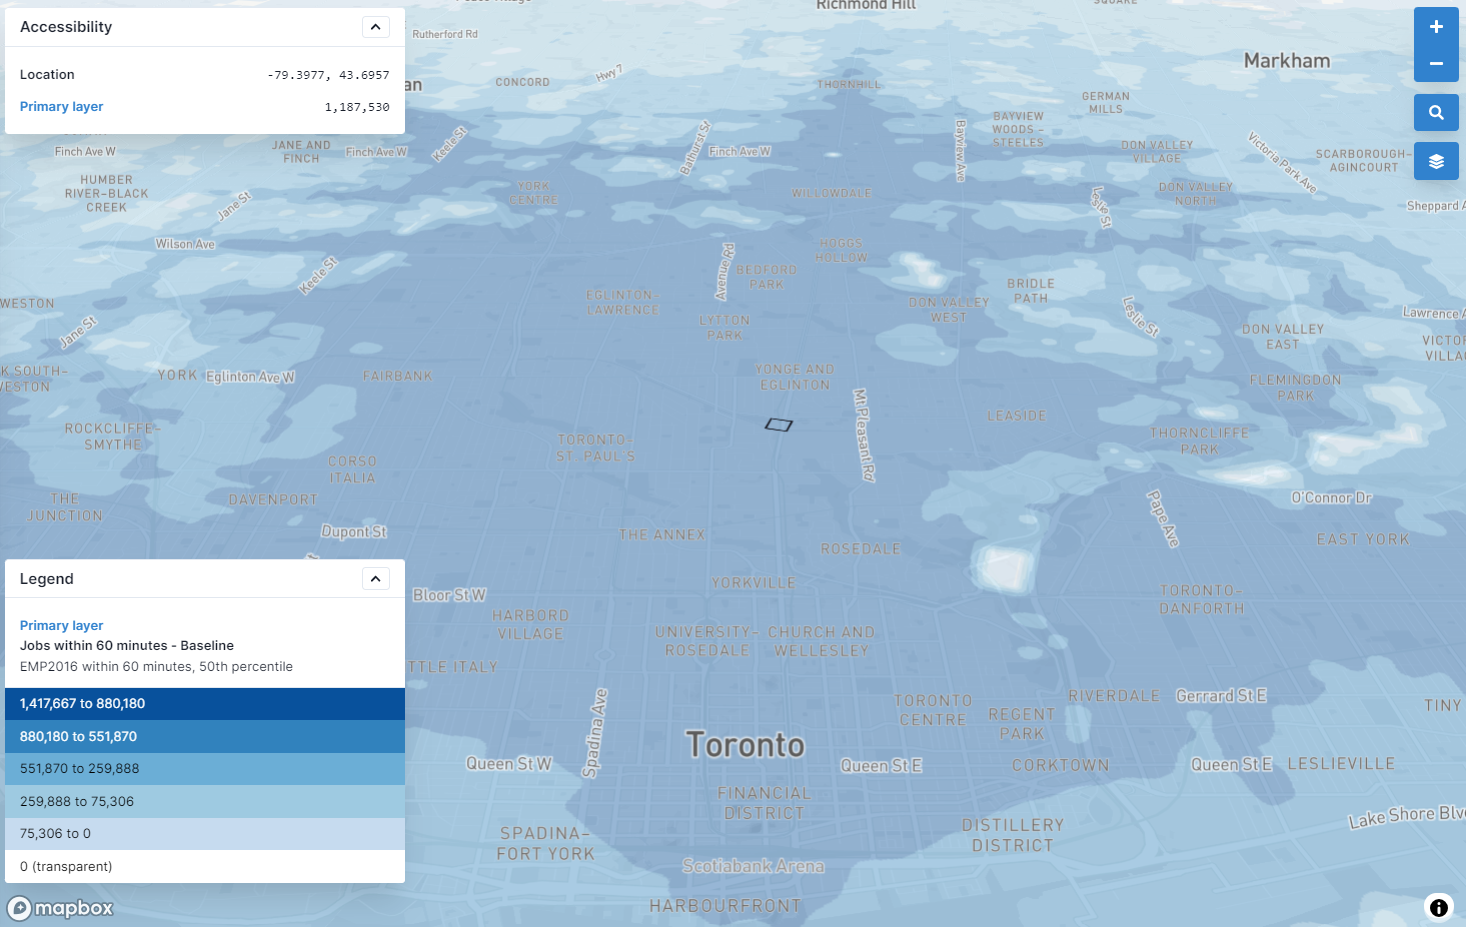
- Enhances spatial dataset and regional analysis maps. The new maps include smooth scaling, rotation, querying access/density values at specific points, toggling layers on and off, and other features (thanks to vector maps and GPU acceleration).
- Adds time-to-nearest nth facility ("dual" accessibility) metrics as an experimental feature for CSV results (#884). Using this feature, you can now calculate additional metrics such as those used in the TransitCenter Equity Dashboard (the time to nearest hospital and time to third-nearest grocery store). See details here. We expect to support map results in an upcoming release; let us know what you think in the meantime!
- Provides more regular and detailed updates on regional analysis progress, helping keep cloud workers active when analyses are queued up (#874).
- Shifts travel time sampling points to better correspond with destination densities (#894). This change will alter results relative to past versions of the R5 routing engine. With related user interface changes, older versions of R5 will now result in slightly offset isochrones.
- Ensures that results are readily comparable within the web interface when regional analysis bounds are reused in a subsequent analysis (#897, #898)
- Improves shapefile upload and validation (#868, #872). Geojson uploads are coming soon.
- Improves GTFS upload and validation (#869, #870, #873).
- Makes default behavior of frequency entries more intuitive.
- Updates R5 to use the latest Java LTS version (21), ensuring security and stability updates over the long term.