Regional Analysis Display
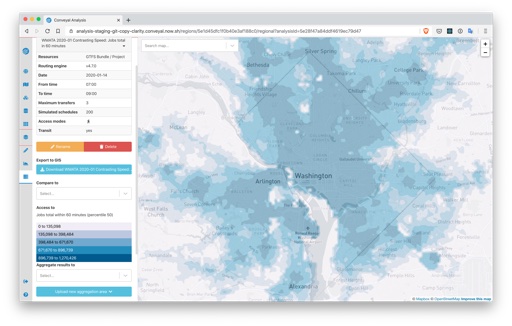
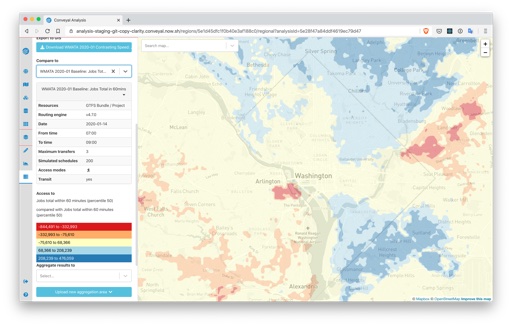
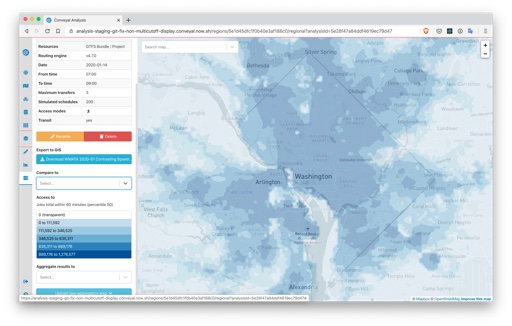
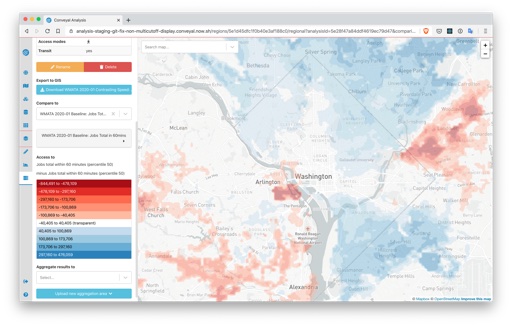
We improved regional analysis result maps.
- Locations with access to 0 opportunities are now transparent.
- Comparisons have an improved color scheme and legend, with blue for areas with increases in accessibility, red for areas with decreases in accessibility, and transparency for areas with 0 or small changes in accessibility.
To calculate the color breaks for a Regional Analysis we use the CKMeans clustering algorithm on a randomly sampled subset of data. This algorithm helps generate clusters quickly.
Before:


Before


Before Comparison
After:


After


After Comparison
Routing Engine
The recommended version of R5 is now v4.8.0. This version:
- Follows the standard definition of percentiles more closely when summarizing travel times (see #563). Relative to past versions of R5, accessibility results for a given travel time and percentile will be slightly higher due to this change. If you need to use past routing engine versions for consistency with past analyses, you can still enter version numbers (e.g. v4.7.0) in the analysis panel.
- Uses Java 11 and updates various dependencies (see #556).
- Speeds up the process of connecting transit stops to destinations (see #564).
- Allows you to create frequency entries in any order. Previous R5 versions would return an error if frequency entries were not ordered by their start time (see #569).
User Interface
- Updated method for isochrone display and download, removing zero-area artifacts that inhibited geoprocessing
- Improved interface with new component library chakra and small changes (e.g. showing scenario names in addition to numbers in modification details)
User Manual
- Made terminology more consistent throughout and expanded the glossary
- Updated screenshots and instructions for interface elements
- Moved materials giving an overview of a feature ahead of any instructions for using it.